New Zealand GDP 2023 Live
- World
- New Zealand
The live counter displays estimated figures for the New Zealand GDP during the current year, from January 1, 2023, up to July 24, 2024,based on the latest data from the IMF.
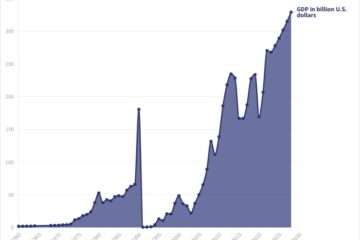
The statistics depict New Zealand’s gross domestic product (GDP) from 1960 to 2023, with projections extending until 2028. According to the latest IMF projections, New Zealand’s GDP in 2023 is anticipated to reach $251.97 billion. IMF’s econometric models indicate a long-term trend towards $251.40 billion in 2024 and $260.37 billion in 2025 for the country’s GDP.
According to IMF projections, New Zealand’s GDP growth rate is anticipated to reach 1.07% by the end of 2023, with an expected growth rate of approximately 0.85% in 2024 and 2.44% in 2025.
Moreover, New Zealand’s GDP per capita is projected to reach $48,826 by the end of 2023, and it is expected to further increase to $48,342 in 2024 and $49,681 in 2025, according to the latest IMF projections.
Furthermore, as of 2023, New Zealand’s nominal GDP ranks 52th globally, while its PPP GDP ranks 62th.
Historical Data: New Zealand GDP from 1960 to 2028
New Zealand’s GDP has demonstrated resilience and growth, driven by the sectors of services, manufacturing, and agriculture, despite the challenges posed by COVID-19. Recovery efforts are currently underway.
| Year | GDP (billion US$) | GDP Per Capita | Growth |
|---|---|---|---|
| 2028 | $301.36B | $56,187 | 2.46% |
| 2027 | $286.60B | $53,849 | 2.51% |
| 2026 | $272.82B | $51,657 | 2.42% |
| 2025 | $260.37B | $49,681 | 2.44% |
| 2024 | $251.40B | $48,342 | 0.85% |
| 2023 | $251.97B | $48,826 | 1.07% |
| 2022 | $241.94B | $47,208 | 2.44% |
| 2021 | $249.31B | $48,778 | 6.09% |
| 2020 | $210.09B | $41,308 | -1.48% |
| 2019 | $213.43B | $42,865 | 2.19% |
| 2018 | $211.95B | $43,250 | 3.36% |
| 2017 | $206.62B | $42,925 | 3.58% |
| 2016 | $188.84B | $40,058 | 3.77% |
| 2015 | $178.06B | $38,631 | 3.74% |
| 2014 | $201.31B | $44,573 | 3.82% |
| 2013 | $190.91B | $42,977 | 2.70% |
| 2012 | $176.21B | $39,973 | 2.25% |
| 2011 | $168.29B | $38,388 | 2.25% |
| 2010 | $146.52B | $33,677 | 1.52% |
| 2009 | $121.37B | $28,209 | -0.14% |
| 2008 | $133.13B | $31,253 | -1.11% |
| 2007 | $137.19B | $32,480 | 3.03% |
| 2006 | $111.54B | $26,655 | 2.88% |
| 2005 | $114.72B | $27,751 | 3.32% |
| 2004 | $103.91B | $25,420 | 4.03% |
| 2003 | $88.25B | $21,914 | 4.55% |
| 2002 | $66.63B | $16,874 | 4.67% |
| 2001 | $53.87B | $13,883 | 3.46% |
| 2000 | $52.62B | $13,641 | 2.91% |
| 1999 | $58.76B | $15,322 | 5.45% |
| 1998 | $56.23B | $14,738 | 0.80% |
| 1997 | $66.08B | $17,474 | 2.05% |
| 1996 | $70.14B | $18,794 | 3.62% |
| 1995 | $63.92B | $17,400 | 4.72% |
| 1994 | $55.31B | $15,280 | 5.12% |
| 1993 | $46.78B | $13,094 | 6.39% |
| 1992 | $41.65B | $11,793 | 1.09% |
| 1991 | $42.75B | $12,230 | -1.09% |
| 1990 | $45.50B | $13,663 | 0.15% |
| 1989 | $43.92B | $13,312 | 0.16% |
| 1988 | $45.18B | $13,759 | -0.35% |
| 1987 | $40.38B | $12,331 | 0.97% |
| 1986 | $30.60B | $9,428 | 2.71% |
| 1985 | $24.68B | $7,601 | 1.62% |
| 1984 | $21.67B | $6,714 | 4.79% |
| 1983 | $24.31B | $7,598 | 3.49% |
| 1982 | $24.16B | $7,656 | 0.93% |
| 1981 | $24.42B | $7,814 | 4.66% |
| 1980 | $23.24B | $7,467 | 1.28% |
| 1979 | $20.73B | $6,668 | 2.19% |
| 1978 | $18.53B | $5,937 | 0.32% |
| 1977 | $15.45B | $4,951 | % |
| 1976 | $13.60B | $4,374 | % |
| 1975 | $12.86B | $4,172 | % |
| 1974 | $13.94B | $4,611 | % |
| 1973 | $12.80B | $4,323 | % |
| 1972 | $9.57B | $3,295 | % |
| 1971 | $7.91B | $2,773 | % |
| 1969 | $5.76B | $2,078 | % |
| 1968 | $5.18B | $1,885 | % |
| 1967 | $5.96B | $2,188 | % |
| 1966 | $5.86B | $2,191 | % |
| 1965 | $5.65B | $2,151 | % |
| 1964 | $7.27B | $2,814 | % |
| 1963 | $6.64B | $2,622 | % |
| 1962 | $6.08B | $2,449 | % |
| 1961 | $5.67B | $2,343 | % |
| 1960 | $5.49B | $2,313 | % |
- World Bank – World Bank national accounts data, and OECD National Accounts data.
- International Monetary Fund:
- United Nations: National Accounts Main Aggregates Database


