In 2025, the global economic hierarchy, measured by Gross Domestic Product (GDP) in Purchasing Power Parity (PPP), presents a different picture compared to nominal GDP rankings. The GDP PPP Ranking 2025 highlights how PPP-adjusted GDP takes into account differences in price levels across countries, offering a more accurate reflection of the relative value of goods and services produced in different nations.
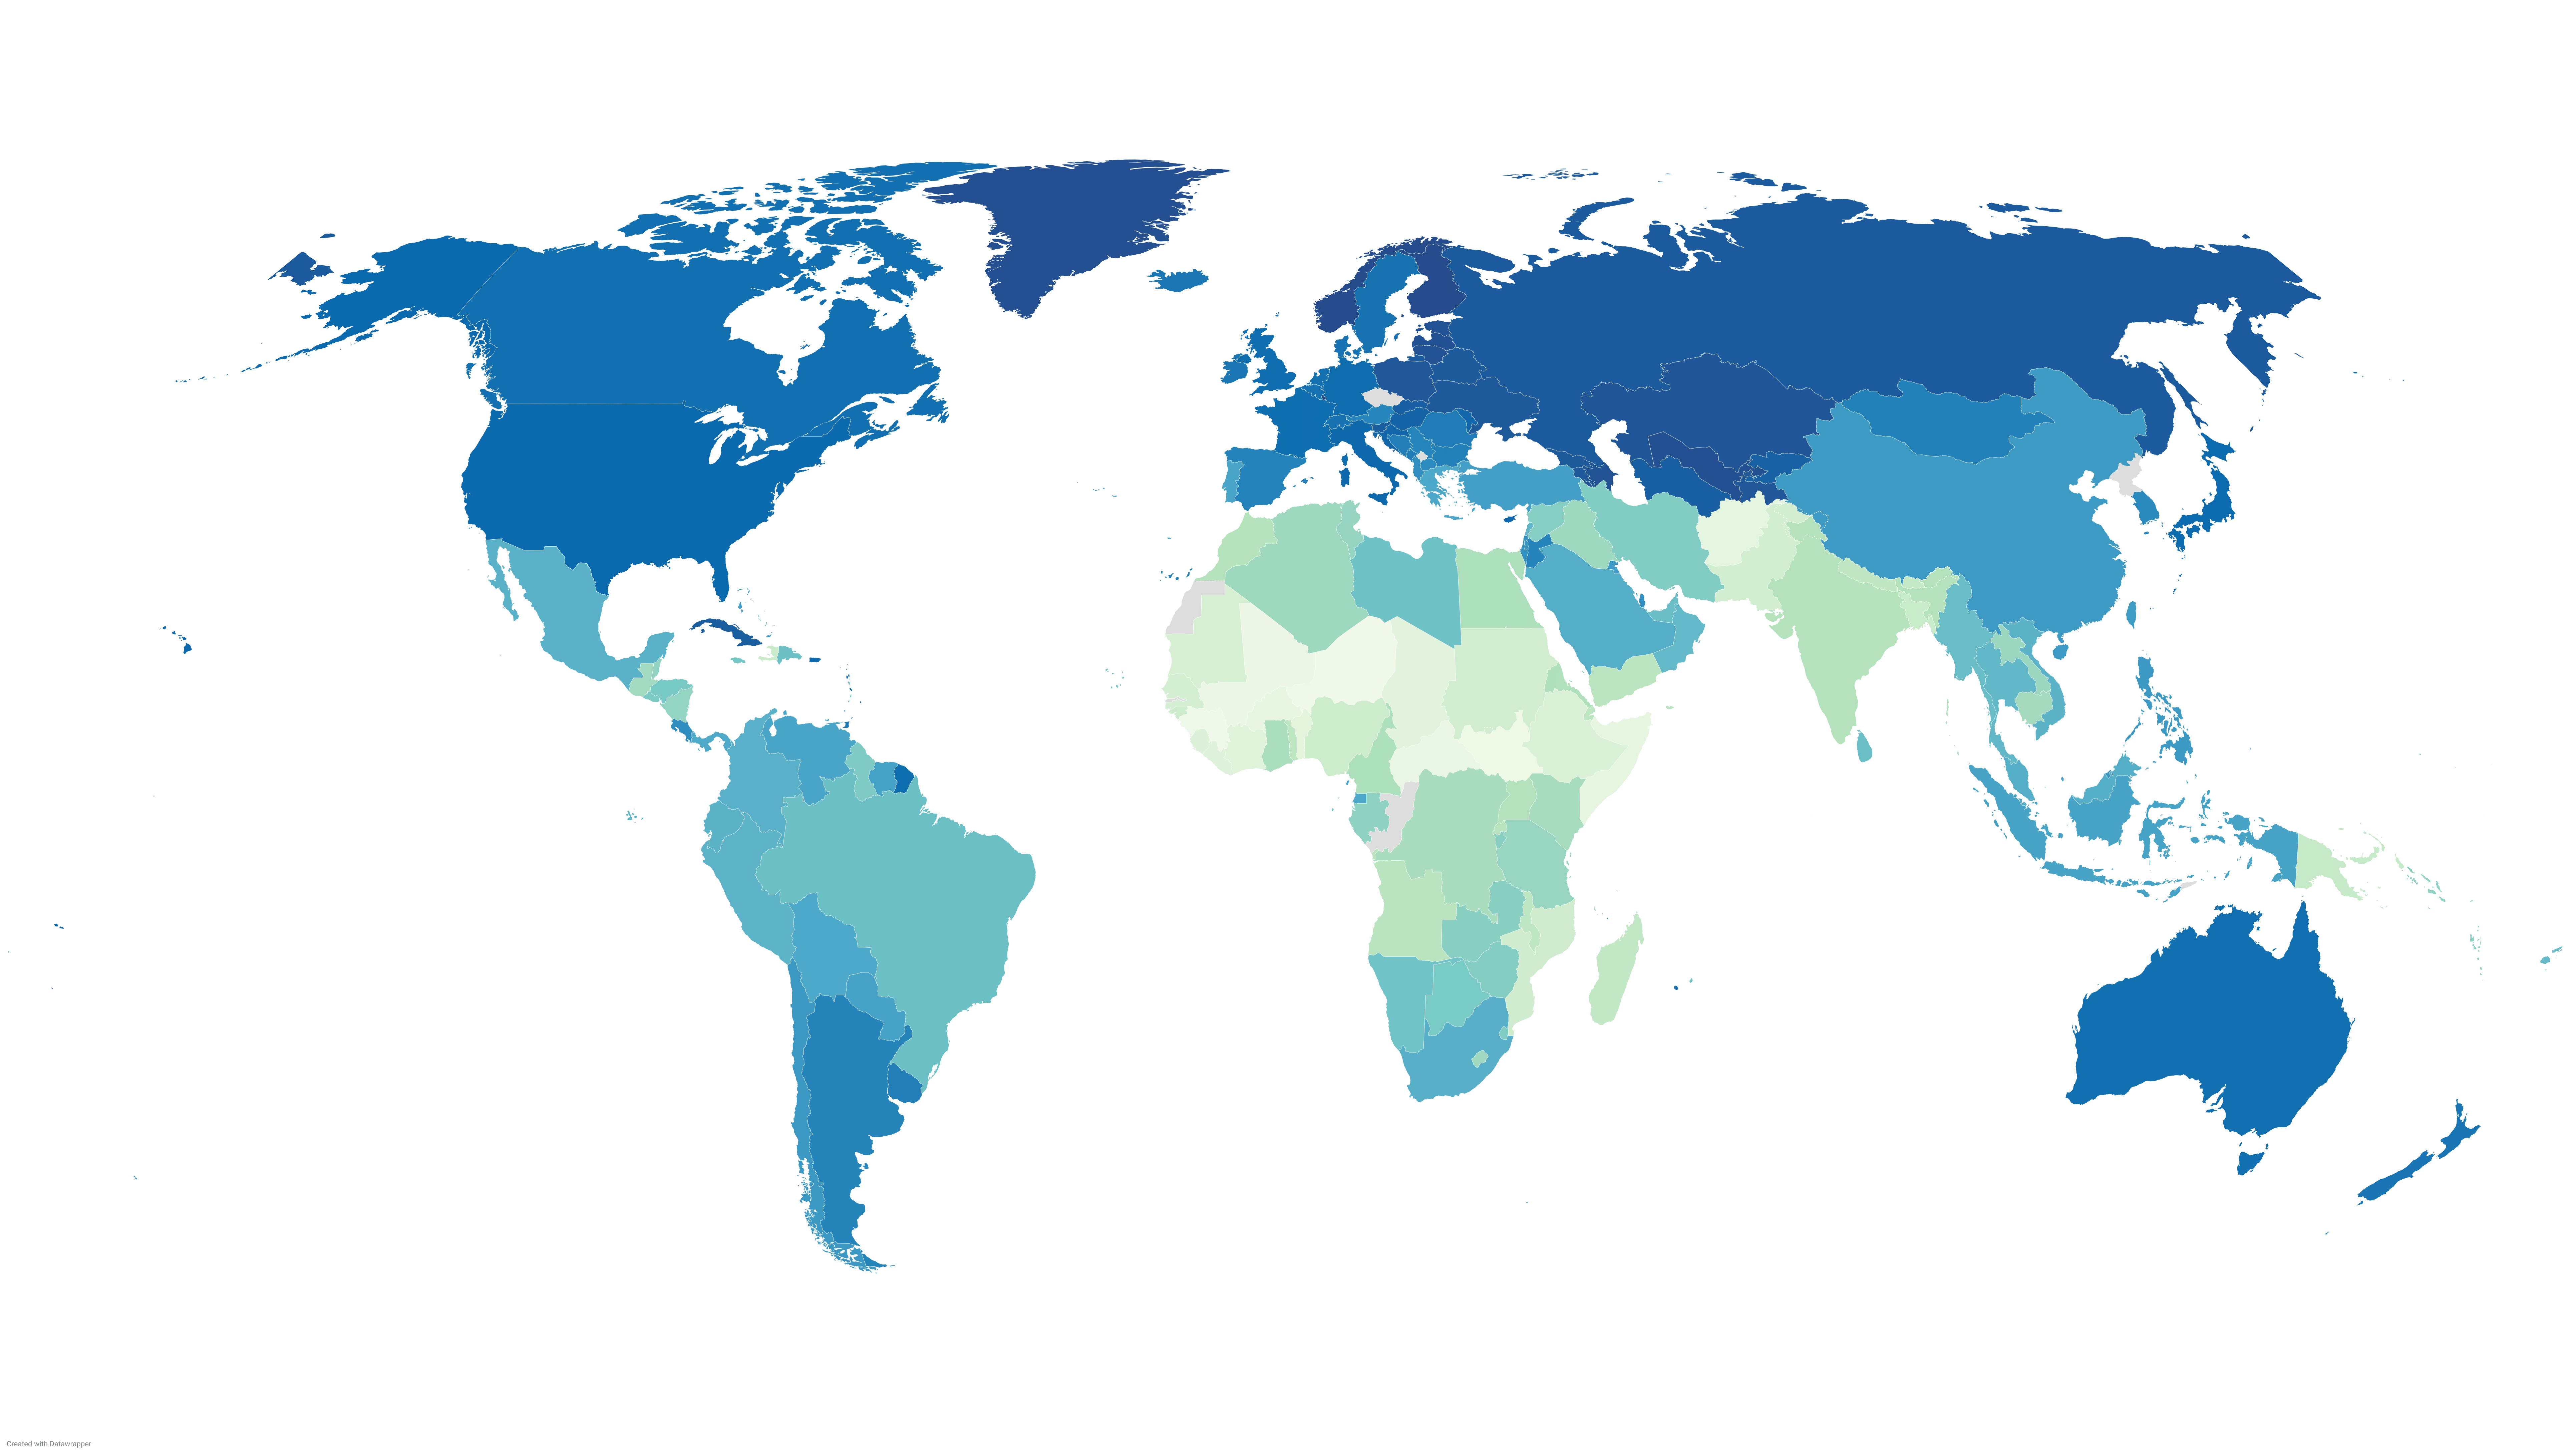
According to the International Monetary Fund’s World Economic Outlook, the projected GDP PPP Ranking for major economies in 2025 is as follows:
China – $40,716,448 million
United States – $30,507,217 million
India – $17,647,050 million
Russia – $7,191,718 million
Japan – $6,741,192 million
Germany – $6,161,002 million
Indonesia – $5,009,483 million
Brazil – $4,958,122 million
France – $4,503,783 million
United Kingdom – $4,447,841 million
These figures represent the estimated Gross Domestic Product (GDP) for each country in the year 2025, highlighting the world’s largest economies and their expected financial influence.
Several emerging markets are showing impressive growth trajectories:
These countries are taking advantage of demographic advantages and economic reforms to improve their global economic position.
GDP (PPP) rankings offer valuable information about countries’ economic health and potential:
These rankings are crucial for policymakers, investors, and businesses to understand market dynamics and make informed decisions.
For a clearer understanding, here is a map illustrating the GDP (PPP) per capita across various countries in 2025
The GDP PPP ranking 2025 highlight the shifting dynamics of global economic power. While traditional economic powerhouses like the United States and Japan maintain significant positions, emerging economies are rapidly increasing their influence. Understanding these rankings is essential for comprehending the complexities of the global economic order and anticipating future trends.